One of the leading causes of failure in power distribution equipment is the breakdown of electrical insulation. Mechanical damage, vibration, excessive temperature, dirty environments, corrosive vapors, and simply too much moisture in the atmosphere should all be considered enemies of insulation.
All of these dangers play a part as time goes on, contributing to electrical stress that already exist on the system. Similar to that of a water pipe, pin holes or cracks will eventually develop, allowing moisture and foreign matter to penetrate the surfaces of the insulation.
This slow process eventually creates a low resistance path for leakage current that will start to compound and build excessive current flowing through the insulation. When checked periodically over time, a gradual drop in insulation resistance should give maintenance technicians plenty of warning before failure.
When advanced insulation degradation goes undetected, what was once electrical insulation becomes a partial conductor. The risk of electrical shock or even death to people around the equipment increases in addition to a greater chance of fire, unplanned downtime, and reduced service life.
Good insulation has high resistance; poor insulation, relatively low resistance. Measuring insulation quality on a regular basis can be the best defense in your maintenance program as it helps to both predict and prevent electrical equipment breakdown.
The most common tool for measuring insulation resistance is a small, portable instrument known as the megohmetter. This tool gives you a direct reading of insulation resistance in the kilo-ohm to Megohm range or higher. For good insulation, the resistance usually reads in the Megohm range.
Consistency is Key
What resistance value you measure can be higher or lower than before, depending upon such factors as the temperature or moisture content of the insulation. A single reading can be good to determine whether insulation resistance meets a minimum value, but the most effective way to interpret the condition is with simple record-keeping.
Its important to understand that insulation resistance readings are considered relative. What value you measure can be quite different for any given equipment tested several days in a row but this does not mean the insulation is bad.
What really matters most is the trend of insulation readings do not show a lessening resistance over time and thus warning of coming problems. The best approach to preventive maintenance of electrical equipment is with periodic insulation resistance testing.

How often you test depends upon the type, location, and importance of the equipment. The most common periods are monthly, twice a year, or once a year. Experience and deep knowledge of your power system are essential for setting a maintenance plan.
As previously stated, its most critical that periodic tests are performed the same way each time. This means using the same test connections and with the same test voltage applied for the same length of time for each test.
An effort should be made to conduct tests at about the same temperature, or correct measured resistance values to the same temperature standard. Noting the relative humidity and temperature near the equipment is also a useful tool for evaluating the overall trend.
DAR and PI Ratios
Good insulation shows a continual increase in resistance over time. The Dielectric Absorption Ratio (DAR) and Polarization Index (PI) are two additional resistance test methods that can be used to graph and determine the general health of electrical insulation relatively quickly.
The PI test uses the one-minute reading divided into the ten-minute reading to provide a ratio. A test like this is useful because it can be performed on very large equipment, and produces an instant condition assessment based on relative readings rather than absolute values.
Simply put, a low ratio indicates little change in resistance (poor insulation), while a high ratio indicates insulation that gains strength over time. This type of test is relatively independent of temperature and can give conclusive information without the records of past tests.
Polarization Index Insulation Condition can further be determined by observing values found in IEEE standards. Less than 1 indicates poor insulation, 1-2 is questionable, 2-4 is considered okay, and greater than 4 is classified as good.
Report Trending
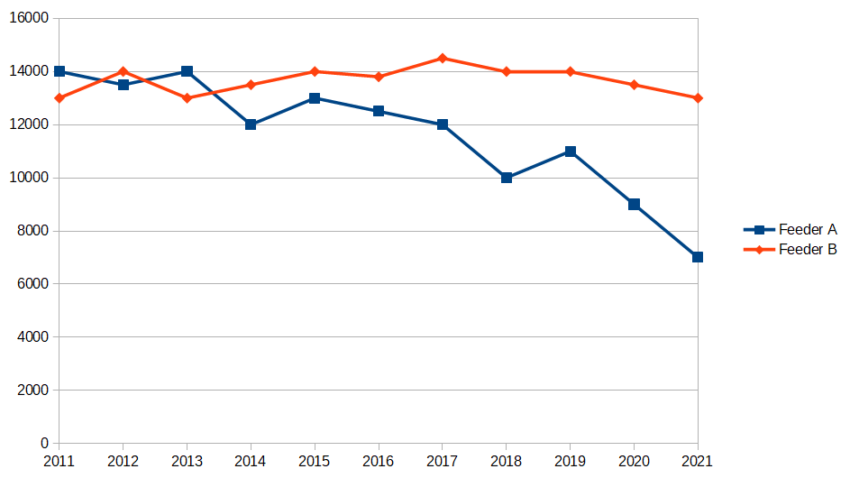
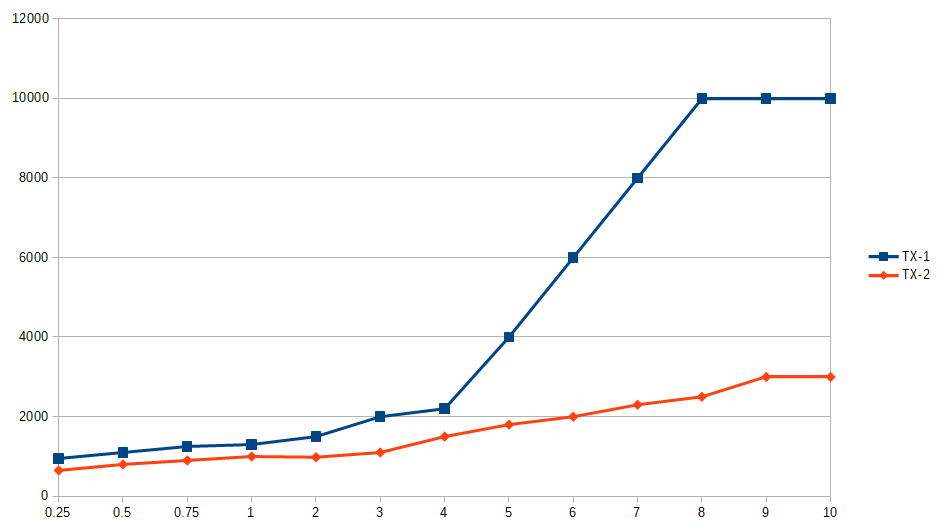
Creating a spreadsheet for record keeping and trending of insulation resistance values can be an economical way for a small plant or facility to monitor the condition of their equipment. Data tables can be created using a new sheet within the workbook for each apparatus.
Just about any modern spreadsheet program makes charting easy, some recommendations include Google Sheets, LibreOffice Calc, and Microsoft Excel. You can add a dedicated chart to each sheet in the workbook or you can overlay the equipment into a single chart on a dedicated sheet.
As time progresses, you can monitor the trend lines to help determine which equipment insulation is starting to degrade or fall out of line in relation to similar equipment in the facility. The most important thing to remember is that insulation resistance test procedures must be consistent and measured results must be temperature corrected for trending to be of any value.
![]() With 20 years of experience in power systems testing and maintenance, I am a seasoned professional dedicated to enhancing operational efficiency. I excel in improving processes, systems, tools, research, training, and technology implementation. Contact me to see how we can keep your systems running at peak performance.
With 20 years of experience in power systems testing and maintenance, I am a seasoned professional dedicated to enhancing operational efficiency. I excel in improving processes, systems, tools, research, training, and technology implementation. Contact me to see how we can keep your systems running at peak performance.