Most electrical testing is conducted with systems de-energized and often times will stress equipment above what would be experienced in normal operating conditions. This is refereed to as “destructive” electrical testing, as it can potentially damage an apparatus by degradation or by human error.
Non-destructive testing is the act of taking measurements while electrical systems remain energized at power frequency to assess potential problems before they arise. It can be likened to an invasive annual medical exam vs. continuous monitoring of your blood content and vital levels.
Methods of Electrical Maintenance
All electrical equipment requires maintenance to keep delivering reliable power. But most testing programs are based on antiquated methods and analysis. Typical maintenance plans for electrical power apparatus are derived from estimates, calculations, and manufacturer’s literature.
- Time Based Maintenance (TBM) – Derived from manufacturers estimates and calculations. Often subjective, expensive and prone to technical and human error. Can result in minimal benefit for maximum effort.
- Condition Based Maintenance (CBM) – Relies on periodic testing such as an annual maintenance outage. Production systems are shut down and electrical equipment is de-energized. Destructive testing methods are used. Work must be completed within a time constrained window. Highly prone to human error and failure upon re-energization.
- Predictive Based Maintenance (PBM) – Advanced maintenance practices that utilize non-destructive testing technology such as sensors (light, sound, gas, radio), computer analysis, and machine learning to monitor and pinpoint anomalies with the system in service. Methods can be deployed on nearly any frequency that suits the asset owner or they can be installed permanently as part of a 24/7 condition based monitoring system.
Non-Destructive Electrical Testing Techniques
The main benefit of non-destructive testing is that it allows an asset owner to find problems that they may have not suspected and prioritize their maintenance plan, which is critical in order to minimize downtime and focus technical resources efficiently. Once the baseline is established, any equipment that deviates is given the most focus while systems are down.
1. Power Quality Monitoring
There are several reasons for poor power quality and electrical disturbances. Loose wiring, poor grounding, utility switching, and unbalanced loads are just a few examples of conditions that can produce noise through an electrical system.
Power quality analyzers can be used to observe real-time readings and also collect data at high speeds for downloading to computers for analysis, opposed to a power recorder or “data logger” which is mainly used for simple voltage and current measurements.
Which type of monitor to install will depend on the data to be captured. For example, a simple load evaluation or utility audit would require a far less sophisticated metering than trying to pinpoint the cause of a nuisance trip or other interruption.
The Problem with Power Quality
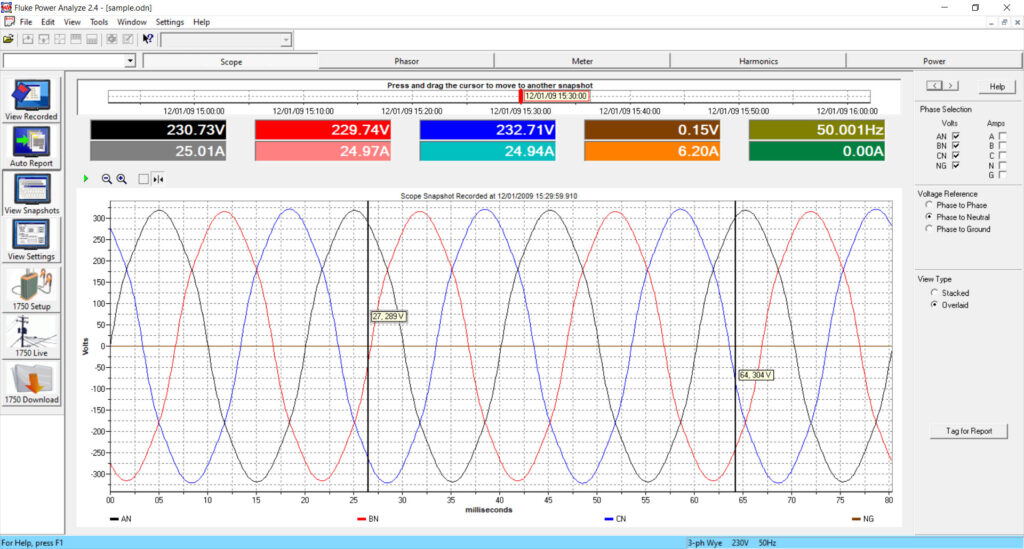
Power quality problems are sudden, unpredictable, and can only be captured using a power quality analyzer installed over a period of days, weeks or months. Each phase in the system has a voltage probe and current sensor applied.
A power quality meter can plot the voltage and current waveform as functions of time. The captured data can be extracted from the recorder and analyzed to determine the overall condition of the power system using various time plots and tables.

Power Quality Meters are able to calculate a large number of electrical measurements and calculate quantities at extremely high speeds. A number of recommendations can be made based on the collected data to improve the quality of an electrical system.
Data points may include minimum, average, and maximum values for parameters such as:
- Voltage, current, and frequency
- Phase relationships and power factor
- Active power (kW), reactive power (kVAr), apparent power (kVA)
- Active energy (kWh), reactive energy (kVArh) and apparent energy (kVAh)
- Harmonic spectrum and distortion
Permanently installed power quality meters can monitor conditions around the clock and be accessed remotely. Alarm set points and limits can be programmed to activate and alert engineering firms or automatically perform switching operations to improve system conditions on the spot.
2. Partial Discharge
Partial Discharge (PD) is a localized electrical discharge that can occur at voids, gaps and similar defects in medium and high voltage insulation systems. If not properly addressed, partial discharge will erode electrical insulation.
This usually results in deterioration, complete breakdown, and failure. The characteristics of partial discharge depend on the type, size and location of equipment. The insulation type, applied voltage, and temperature will all have an effect on the result.
Online Partial Discharge testing is a non-destructive, non-invasive predictive maintenance tool that gauges the condition of insulation systems based on measuring discharge at the system operating voltage. With suitable sensors, PD activity can be monitored and trended either on a temporary or continuous basis.
3. Electromagnetic Signature Analysis (EMSA)
Electromagnetic Signature Analysis (EMSA) resembles power quality analysis in that data is collected using current transformers. The difference is rather than utilize connections around each energized phase conductor, a single split core radio frequency current transformer (RFCT) is placed around a power conduit, ground or neutral lead of the device under test.
Radio frequency signals generated from the electrical apparatus create an EMSA signature, which is unique for each physical location and defect within the system. No connection is made to the existing equipment – all data is collected through electromagnetic coupling.
Each anomaly produces a unique pattern at different frequencies and amplitudes. Computers are used to review and interpret the collected EMSA signatures, which can be conducted by engineers or autonomously with machine learning.
Corona, arcing, radio signals, random noise, and electronic transients can all be part of an EMSA signature. Data collection follows the international standard CISPR 16, which specifies the measurement of radio disturbance voltages and currents in the frequency range 9 kHz to 1 GHz.
4. Gas Monitoring
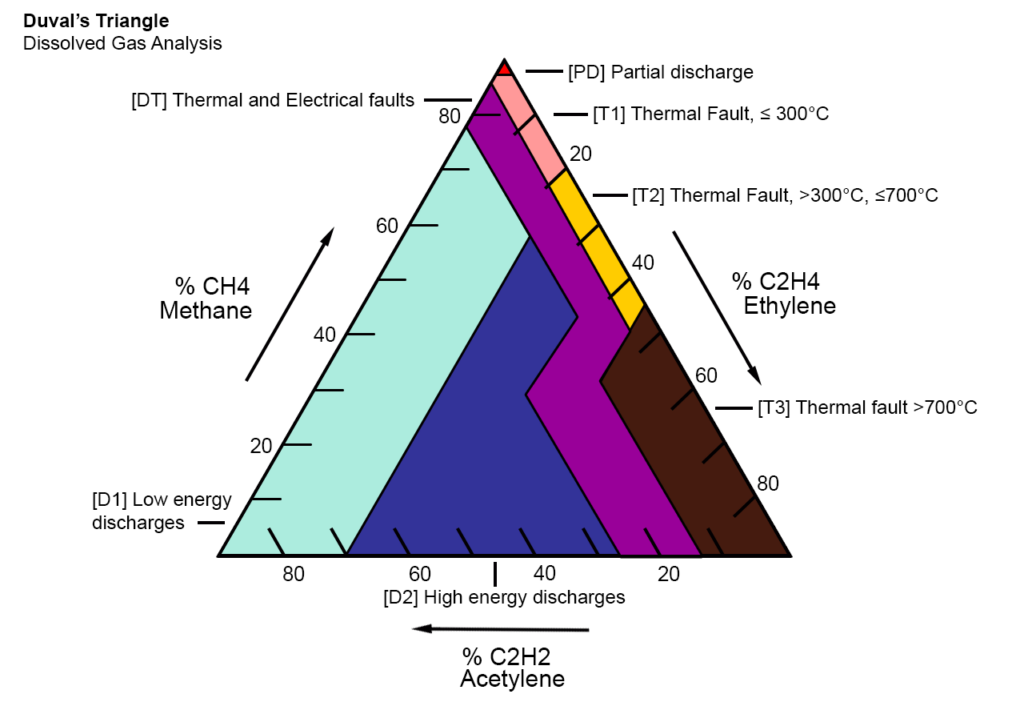
Dissolved gas is the first indicator of a problem and can identify deteriorating insulation and oil, overheating, hot spots, partial discharge, and arcing. This is, by far, the most important tool for determining the health of a transformer.

The conventional way to test for dissolved gas is to manually draw an oil sample from the transformer at regular maintenance intervals and send to a laboratory for analysis. When done properly, equipment must be shut down for safety and the sample must be taken with care not to alter the fluid by introducing outside gasses.
After the painstaking sample process, the oil must be shipped to a laboratory where it can be analyzed by a second technician. This process can take a week or more, unless oil testing can be performed in the field or the testing firm has an in house laboratory to save time.
How often do you test DGA?
Another challenge is that gasses can go undetected between testing cycles. If DGA is the first indicator of a problem, it makes sense to conduct the test at a higher frequency to catch anomalies before they become a serious failure.
Asset owners need to balance their maintenance program with the reliability requirements of the equipment. Online DGA monitoring allows a continuous look at gases within the main tank of a transformer around the clock. There are two types of DGA monitoring: key gas and multi-gas.
Key Gas Monitoring
Key gas monitoring is an economical solution that allows for a wider coverage of assets. Its an effective method that typically detects hydrogen gas only.
Why Hydrogen? This gas becomes elevated when thermal levels are above a transformers normal operating temperature. It can provide an early indication of most abnormal conditions that may occur in the main tank.
Multi-Gas Monitoring
Multi-gas monitoring provides a more detailed analysis of a transformer’s condition but is more expensive. This method is more appropriate for critical transformers or those subjected to heavy loading and fluctuation.
- 5 Gas measures combustible gases such as hydrogen, methane, ethane, ethylene and acetylene.
- 7 Gas measures combustible gases with the addition of carbon monoxide and carbon dioxide.
- 9 Gas adds oxygen and nitrogen levels. Provides the ability to identify fault type (arcing, thermal, partial discharge)
Multi-gas monitoring allows an asset owner to extend routine maintenance and allows for an instant assessment of the transformer’s condition. Due to their complexity, multi-gas monitors require more maintenance and may have a shorter life span than key gas monitors.
5. Transformer Passive Drying
Moisture in a liquid-filled transformer can cause irreversible damage to its paper insulation. Whenever transformer moisture content doubles, the paper insulation lifespan is cut in half.
Traditional methods of drying transformers involve field or factory methods which require the transformer to be taken offline or even transported to another facility. The oil is continually passed through a drying system until moisture is reduced to acceptable levels.

Moisture Can’t Wait
The problem is lead time. Simple dehydration in the field can typically be achieved in 1-2 days, with full dry-outs taking anywhere from 7-14 days. If you opt to send your transformer to a factory, anticipate to go without your equipment for over 40 days!
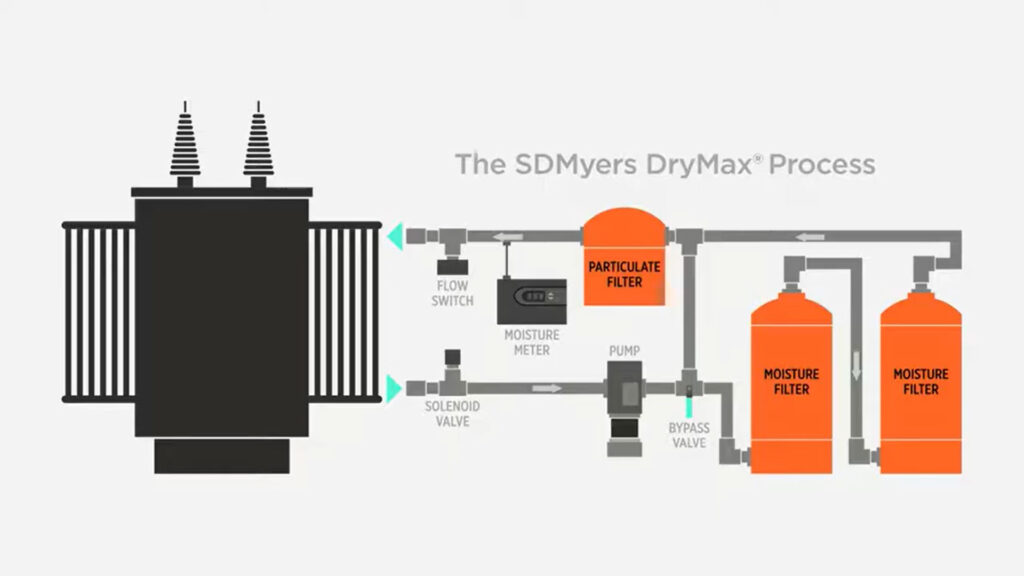
On-line (energized) drying solutions connect directly to a live transformer and can remain there for as long as needed. Further degradation of the paper insulation is prevented upon installation and the system continually works to improve reliability. Data can be monitored remotely by technicians and Ai.
6. Ultrasonic Inspections
Ultrasonic testing (UT) is a method of diagnosing electrical anomalies by measuring sound frequencies, or pitch from electrical apparatus. The typical range for UT is from 500 kHz to 20 MHz, many times higher than the limit of human hearing.
Arcing, tracking, corona, and gas leaks all produce ionization which disturbs the surrounding air molecules. An ultrasonic tester detects high frequency sounds produced by these emissions and translates them down into human audible ranges.
The sound of each emission is heard using headphones and the intensity of the signal is observed on a display panel. These sounds may be recorded and analyzed through ultrasound spectral analysis software for a more accurate diagnosis.
7. Vibration Analysis
As mechanical or electrical faults develop in rotating machinery, vibration levels increase. These increases in vibration and noise levels occur at different severity of a developing fault.
Accelerometers can be used to take vibration measurements while equipment remains energized and in service. As the machine under test operates, the accelerometer detects its vibration along three planes of movement (vertical, horizontal and axial).
The data is loaded into software for analysis. Unique signatures are created based on the type and severity of problems. Several signatures have been documented and cataloged over decades which makes computer analysis and AI recommendations easy to implement.
8. Infrared
Thermal imagers are cameras that detect infrared radiation (not normally detectable by humans) and converts that data into a visual image. Infrared cameras are ideal for inspecting electrical systems because they do not require contact and can be performed quickly with equipment in service.
Comparisons can be made between similar components to make a relative assessment. This offers an excellent means of troubleshooting because an image doesn’t need to be fully understood in order to determine whether further investigation is required.
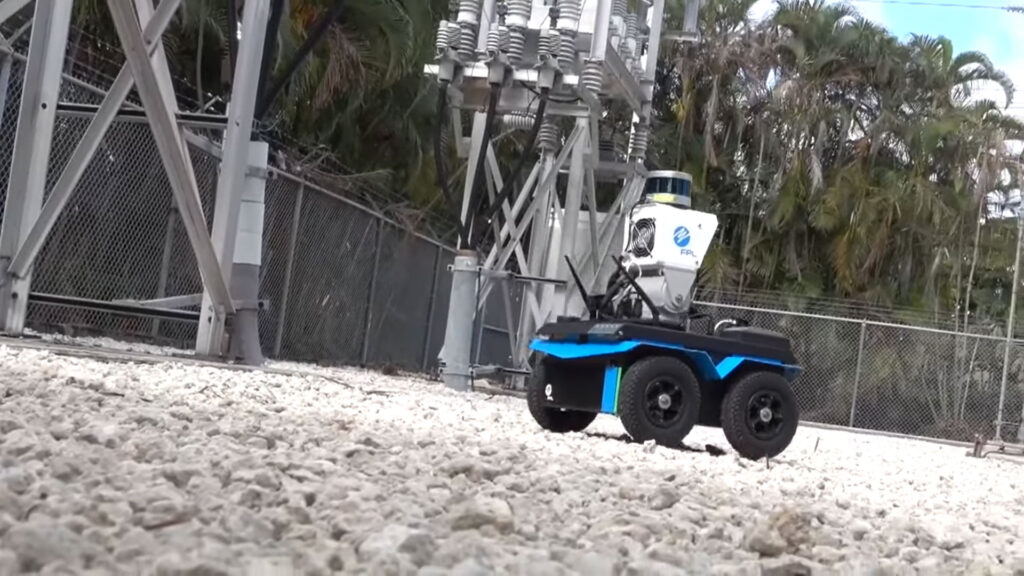
Inspection robots can be deployed to conduct infrared scans and plan efficient outages more precisely, thereby reducing the downtime required to conduct maintenance tasks. This increases equipment reliability and increases the safety of people and the environment.
Florida Power and Light developed its own autonomous robot to perform outdoor substation infrared inspections. The robot is programmed to conduct two inspections per day and can be controlled on demand via remote operation.

Shortly after implementation, the robot was able to successfully identify equipment that was overheating and alerting crews who responded to fix the issue. The utility estimates the device saved nearly 10,000 customers from potential power loss.
Infrared cameras do not need visible light to operate, making them ideal for installation within an electrical enclosure. Micro sensors and wide angle cameras fixated at critical points could be accessed remotely at any time. Software systems can be used to detect elevated temperature points with set points and alarms.
9. Online 24/7 Monitoring
Perhaps the greatest advancement in non-destructive testing and Predictive Based Maintenance comes from the ability to monitor equipment in real-time from anywhere in the world. Nearly any device with a network connection can be accessed remotely via the internet by analysis software.
If any asset goes into alarm status, maintenance crews can be notified immediately on their cellphones and respond. Machine learning tools can also be used to make better determinations of a problem and offer assessment recommendations based on similar equipment stored in a central database.
